At Bellmont, one of our core investment beliefs is that a portfolio’s strategic asset allocation (SAA) is the major determinant of portfolio outcomes. This assertion is backed up by several academic studies, including Brinson et al 1986 and Ibbotson et al 2000.
Accordingly, most of the time we keep all of our portfolios at their SAA weights.
However, we do believe that portfolios can be enhanced by adjusting a portfolio’s asset allocation when markets are at extremes. We think that using dynamic asset allocation (DAA) can increase a portfolio’s returns, reduce portfolio risk, or both.
We do stress that our version of DAA is not the namby-pamby version of DAA employed by some other market participants, which can better be categorised as pseudo-rebalancing, or an overengineered quant overlay, hoping to add 25 basis points per annum.
Our version of DAA is not the namby-pamby version of DAA employed by some other market participants, which can better be categorised as pseudo-rebalancing, or an overengineered quant overlay, hoping to add 25 basis points per annum
Essentially, we believe in buying low and selling high, and making meaningful adjustments to the portfolios that we hope will play out over the medium term. We do not simply make shorter-term changes in asset allocation, which are more akin to tactical asset allocation (TAA).
We are not yet convinced about TAA adding value. Correlations of various variables are often not statistically significant, given the overwhelming contribution from black swan events (i.e use DAA when markets are at extremes, however it’s unreliable in between)
Buy low, sell high is really easy to say, but really hard to do. This is because it is really hard to get a handle on what is high and what is low, and whether a stock price is high for a reason or low for a reason?
This is why Michael Block, Chief Investment Officer of Bellmont, often says that asset allocation is a much more difficult pursuit than so many other portfolio activities, including manager alpha, which contribute so little to long-term portfolio outcomes.
Adjusting Equity Exposure Using CAPE
According to most academic research, SAA accounts for 86 to more than 100 per cent of portfolio outcomes (yes, it can be over 100 per cent if manager alpha is negative!).
In our opinion, the Cyclically Adjusted Price Earning Ratio (CAPE) is a very good and maybe the very best long-term indicator of fair value for equities. CAPE or The Shiller PE is named after Professor Robert Shiller of Yale University, who won the Bank of Sweden Prize for Economic Sciences (often wrongly referred to as a Nobel Prize) for this pioneering research.
The Shiller PE, which looks at a trailing price-to-inflation-adjusted earnings ratios over more than 100 years, suggests that 17.7X is a reasonable measure of the US equity market’s fair value.
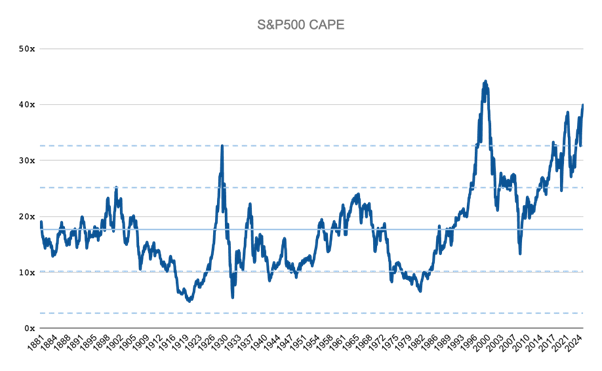
Source: Robert Shiller, Yale Data
Adjusting equity exposure using the CAPE works exceptionally well over the long term. For example, here is a scatter plot, courtesy of Invesco, showing the strong inverse correlation between CAPE and future returns.
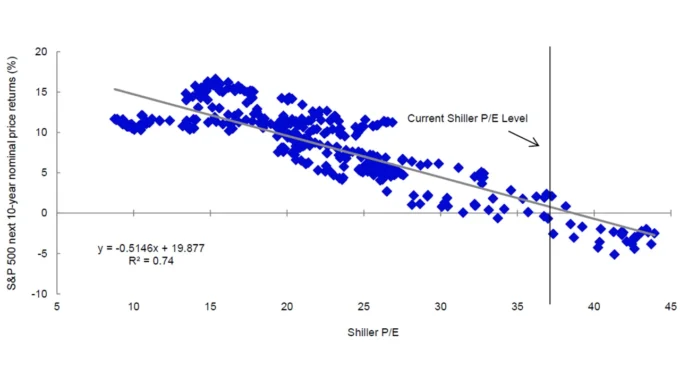
By the way, this relationship suggests that with trailing CAPE at around 35-40 times, future US equity returns will be very low (on average) for the next 10 years.
Measuring Excess Equity Yield Against Bonds
The excess CAPE yield is another way to represent the long-term relationship between this valuation measure and 10-year annualised returns. The excess CAPE yield simply measures the excess yield generated from equities relative to real, long-term bond yields through the cycle. This tells you how much extra return stocks offer over government bonds, adjusting for inflation.
This shows the extremely high correlation between excess yield and future 10-year returns, as well as the current deviation between the two, which is proving to be one of the largest and longest in history!
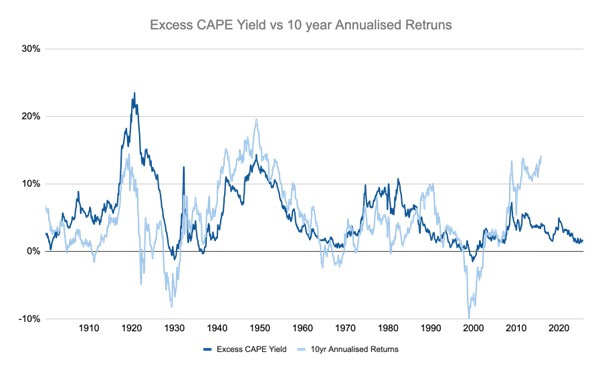
Source: Robert Shiller, Yale Data
Shortcomings of the CAPE Indicator
The CAPE is a wonderful long-term indicator, but it has many shortcomings that prevent us from betting our lives on it. Here are but a few.
- CAPE is a very poor predictor of shorter-term returns. In a world where CIOs are judged on two to three-year returns, the Shiller PE is not as useful as we would hope. In short, just like other great long-term indicators (e.g. The Big Mac Index) it can be wrong for a long time. Or, as we prefer, just a bit too early.
- The last 100 years included a World War, a Great Depression, the Global Financial Crisis, a pandemic and numerous other dislocations. How reliable is the 17.7x number going to be, looking forward?
- The current make-up of the S&P 500 is very different to that of 50 years ago. Essentially, why would we use a measure of stodgy value stocks to evaluate the current market that has a much higher number of technology and growth stocks?
Michael Block, Chief Investment Officer at Bellmont, adjusts the Shiller PE for these events and numerous other factors and suggests 27x (as tattooed on his shoulder) is a better long-term average.
See the chart below for the average since 1990.
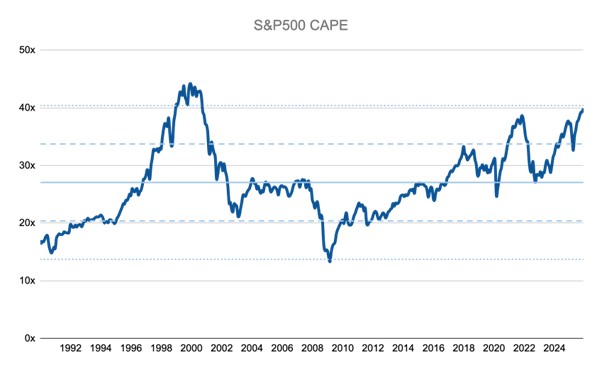
Source: Robert Shiller, Yale Data
Regardless of how the CAPE is adjusted, it is absolutely clear that equities are very expensive by historical standards.
Michael Block is Chief Investment Officer at boutique wealth manager Bellmont. Daniel Deverich is Head of Equities at Bellmont. The opinions expressed in this article are their own.
This article was originally published on i3-invest.